

The share market represents one of humanity’s most remarkable financial innovations, serving as the beating heart of modern economic systems worldwide. Whether you’re a complete beginner dreaming of financial freedom or someone who has watched market movements with curiosity, understanding How the Share Market Works is your gateway to potentially life-changing wealth creation. This comprehensive guide will transform complex financial concepts into actionable knowledge, empowering you to make informed investment decisions that could secure your financial future.
- What is the Share Market: Foundation of Modern Finance
- The Mechanics of Stock Exchange Operations
- Market Participants: The Ecosystem Players
- Price Discovery Mechanism: Supply and Demand Dynamics
- Types of Stock Market Analysis
- Investment Strategies and Approaches
- Risk Management and Portfolio Diversification
- Technology’s Role in Modern Trading
- Regulatory Framework and Investor Protection
- Economic Indicators and Market Correlation
- Building Your Investment Portfolio
- Recommended Portfolio Allocation by Asset Class
- Essential Investment Questions: Best Practices and Timing Guide
- Conclusion: Your Journey in the Share Market
- Frequently Asked Questions About Share Market Operations
- Disclaimer
In today’s rapidly evolving economic landscape, traditional savings accounts barely keep pace with inflation, making equity investments increasingly essential for long-term wealth preservation and growth. The Indian share market alone has created countless success stories, with companies delivering exceptional returns to patient investors over decades.
What is the Share Market: Foundation of Modern Finance
The share market, fundamentally, is a sophisticated marketplace where ownership stakes in publicly traded companies are bought and sold. When you purchase a share, you’re not merely buying a piece of paper or digital entry—you’re acquiring partial ownership in a real business with tangible assets, revenue streams, and growth potential.
How the Share Market Works begins with understanding that it operates on two distinct levels: the primary market and secondary market. The primary market is where companies first offer their shares to the public through Initial Public Offerings (IPOs), essentially raising capital for business expansion or debt reduction. Once these shares are issued, they enter the secondary market, where existing shareholders can trade them among themselves through stock exchanges.
The beauty of this system lies in its democratic nature—it allows ordinary individuals to participate in corporate success stories while providing companies with the capital they need to innovate, expand, and create jobs. This symbiotic relationship has powered economic growth across developed and emerging markets for centuries.
| Market Component | Purpose | Key Players | Example |
|---|---|---|---|
| Primary Market | Capital raising for companies | Companies, Investment Banks, IPO investors | Zomato IPO 2021 |
| Secondary Market | Trading existing shares | Retail investors, Institutions, Brokers | Daily NSE/BSE trading |
| Regulatory Framework | Market oversight and protection | SEBI, Stock Exchanges | Insider trading prevention |
| Settlement System | Transaction completion | Clearing corporations, Depositories | T+2 settlement cycle |
The Mechanics of Stock Exchange Operations
Stock exchanges serve as the critical infrastructure that makes How the Share Market Works possible. In India, the Bombay Stock Exchange (BSE) and National Stock Exchange (NSE) dominate this landscape, each playing unique roles in facilitating seamless trading.
The BSE, established in 1875, holds the distinction of being Asia’s oldest stock exchange and has witnessed India’s transformation from a colonial economy to a global economic powerhouse. Its benchmark index, the Sensex, tracks the performance of 30 large-cap companies and serves as a barometer of Indian economic health.
The NSE, founded in 1992, revolutionized Indian trading by introducing electronic trading systems, replacing the traditional open outcry method. The Nifty 50 index, comprising 50 companies across 13 sectors, provides a broader representation of market performance than the Sensex.
Modern stock exchanges operate through sophisticated electronic matching systems that pair buy and sell orders in milliseconds. When you place a buy order through your broker, the exchange’s computers automatically search for the best available sell order at your specified price or better. This electronic infrastructure ensures fair price discovery, transparent transactions, and efficient market operations.
| Exchange Feature | BSE | NSE |
|---|---|---|
| Establishment Year | 1875 | 1992 |
| Listed Companies | 5000+ | 2000+ |
| Benchmark Index | Sensex (30 stocks) | Nifty 50 (50 stocks) |
| Specialty | Historical significance | Electronic trading pioneer |
| Market Cap Ranking | 9th globally | 4th globally by volume |
Market Participants: The Ecosystem Players
Understanding How the Share Market Works requires recognizing the diverse participants who collectively create market dynamics. Each participant type brings different motivations, timeframes, and capital sizes, contributing to market liquidity and price discovery.
Retail investors, the individual participants, form the foundation of market democracy. These investors range from first-time buyers investing modest amounts to sophisticated individual traders managing substantial portfolios. Despite their smaller individual capital, retail investors collectively wield significant influence, especially during major market movements.
Institutional investors, including mutual funds, pension funds, insurance companies, and endowments, typically manage large capital pools on behalf of multiple beneficiaries. Their professional management teams conduct extensive research before making investment decisions, often setting market trends through their substantial buying and selling activities.
Foreign Institutional Investors (FIIs) and Foreign Portfolio Investors (FPIs) bring international capital and global perspective to domestic markets. Their participation connects local markets to global economic trends and provides additional liquidity, though their movements can also introduce volatility during uncertain times.
Market makers and brokers facilitate trading by providing liquidity and transaction services. Modern electronic platforms have democratized access to markets, allowing retail investors to trade with the same speed and efficiency as institutions.
| Participant Type | Capital Range | Investment Horizon | Market Influence | Primary Motivation |
|---|---|---|---|---|
| Retail Investors | ₹1,000 – ₹50 lakhs | 1–30 years | Low–Medium | Wealth creation |
| Mutual Funds | ₹100 crores – ₹1 lakh crores | 3–10 years | High | Portfolio returns |
| FIIs/FPIs | ₹1,000 crores+ | 1–5 years | Very High | Global diversification |
| Insurance Companies | ₹10,000 crores+ | 10–30 years | High | Long-term stability |
| Pension Funds | ₹5,000 crores+ | 20–40 years | Medium–High | Retirement security |
Price Discovery Mechanism: Supply and Demand Dynamics
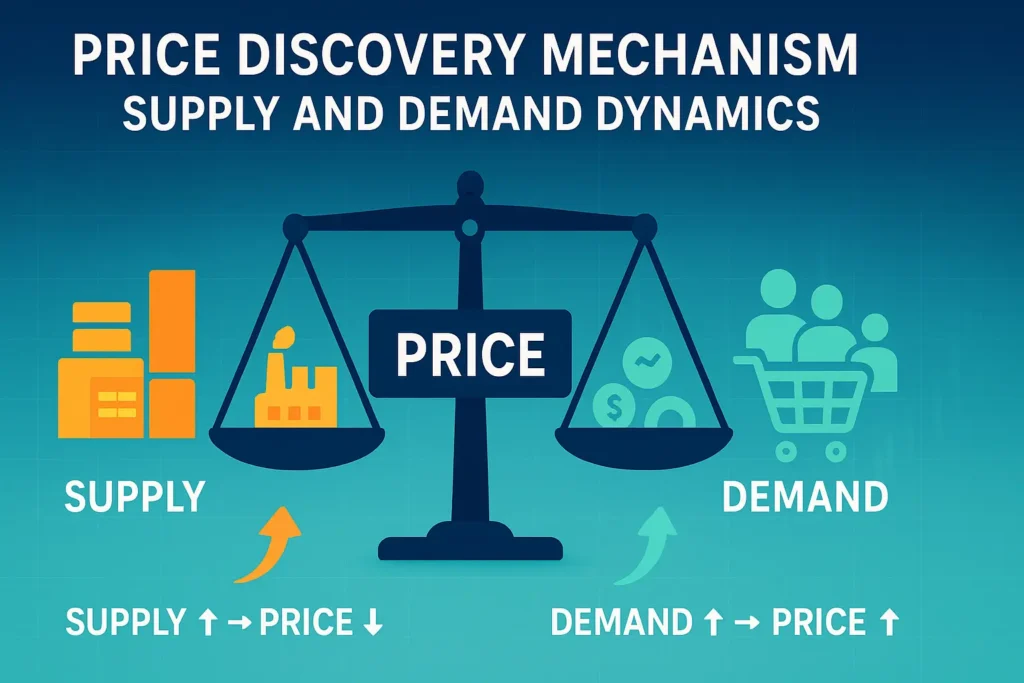
The fundamental principle behind How the Share Market Works rests on supply and demand dynamics, similar to any marketplace but with sophisticated mechanisms for price discovery. Stock prices fluctuate based on investors’ collective assessment of a company’s current value and future prospects.
When positive news emerges about a company—such as strong quarterly results, new product launches, or favorable regulatory changes—demand for its shares typically increases. If the supply of shares remains constant while demand rises, prices move upward. Conversely, negative developments can trigger selling pressure, driving prices down.
Market sentiment plays a crucial role in price movements beyond fundamental company performance. During bull markets, optimism prevails, and investors willingly pay premium prices for shares, expecting continued growth. Bear markets reflect pessimism, with investors selling at discounts to avoid further losses.
The bid-ask spread represents the gap between the highest price buyers are willing to pay (bid) and the lowest price sellers will accept (ask). Narrow spreads typically indicate liquid markets with many participants, while wide spreads suggest limited liquidity or high volatility.
Volume analysis provides insights into the strength of price movements. High trading volumes accompanying price increases suggest strong conviction among buyers, while low volumes might indicate weak momentum. Professional traders often use volume patterns to validate price trends and identify potential reversals.
| Price Movement Factor | Impact Direction | Typical Duration | Example |
|---|---|---|---|
| Quarterly Earnings Beat | Positive | 1–3 days | Strong Q4 results |
| New Product Launch | Positive | 1–4 weeks | Major product announcement |
| Regulatory Approval | Positive | 1–2 days | Drug approval for a pharmaceutical firm |
| Economic Recession | Negative | 6–18 months | Financial crisis |
| Interest Rate Hike | Negative | 1–7 days | Central bank policy changes |
Types of Stock Market Analysis
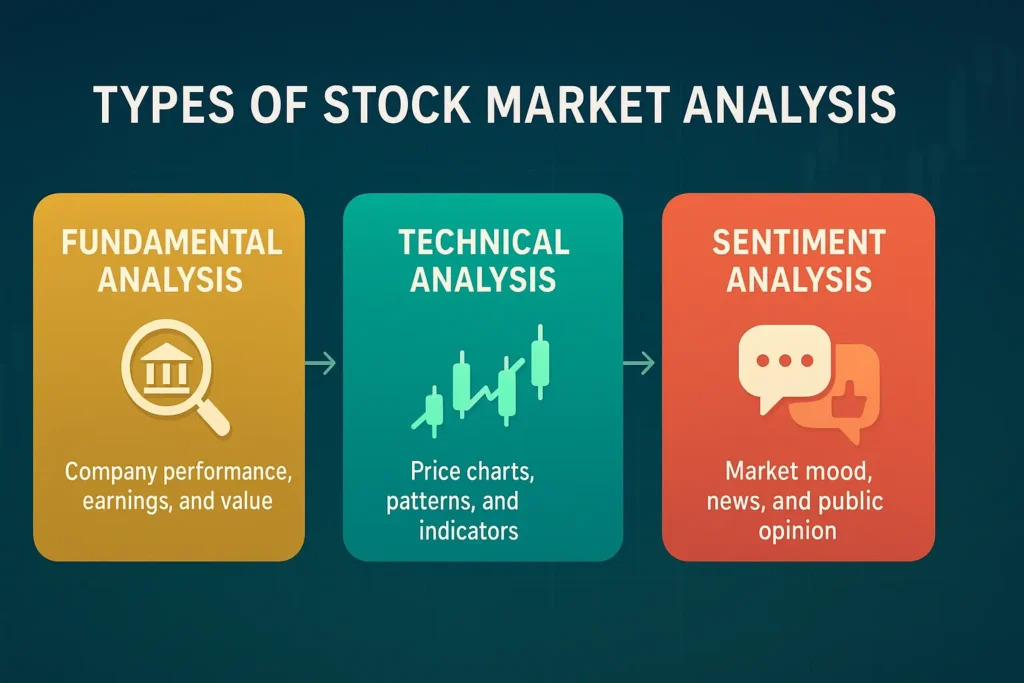
Successful navigation of How the Share Market Works requires mastering different analytical approaches, each offering unique insights into investment opportunities. The two primary methodologies—fundamental and technical analysis—serve complementary roles in investment decision-making.
Fundamental analysis involves deep examination of a company’s financial health, business model, competitive position, and growth prospects. This approach treats stocks as ownership stakes in real businesses, focusing on intrinsic value rather than short-term price movements. Fundamental analysts study income statements, balance sheets, cash flow statements, and key financial ratios to assess whether a stock is undervalued or overvalued.
Key fundamental metrics include the Price-to-Earnings (P/E) ratio, which compares stock price to earnings per share, helping investors gauge valuation relative to profitability. Return on Equity (ROE) measures how efficiently a company generates profits from shareholders’ investments. Debt-to-Equity ratios reveal financial leverage and risk levels.
Technical analysis focuses on price patterns, trading volumes, and market momentum to predict future price movements. Technical analysts believe that all fundamental information is already reflected in stock prices, making price action the primary source of insight. They use charts, trend lines, moving averages, and various indicators to identify entry and exit points.
Moving averages smooth out price fluctuations to reveal underlying trends. When stock prices trade above their moving averages, it often indicates upward momentum, while prices below moving averages might suggest downward pressure. Support and resistance levels mark price points where stocks historically face buying or selling pressure.
| Analysis Type | Time Horizon | Key Tools | Best For | Skills Required |
|---|---|---|---|---|
| Fundamental Analysis | 6 months – 5 years | Financial statements, ratios | Long-term investing | Accounting knowledge |
| Technical Analysis | Days – 6 months | Charts, indicators | Short-term trading | Pattern recognition |
| Quantitative Analysis | Varies | Statistical models | Systematic strategies | Mathematical skills |
| Sentiment Analysis | Days – weeks | News, social media | Market timing | Psychology understanding |
Investment Strategies and Approaches
The diversity of investment strategies reflects the many ways How the Share Market Works can be leveraged for wealth creation. Each approach suits different risk tolerances, time horizons, and financial goals.
Value investing, popularized by Warren Buffett, focuses on purchasing undervalued companies trading below their intrinsic worth. Value investors seek businesses with strong fundamentals, competitive advantages, and temporary market pessimism that creates buying opportunities. This patient approach often requires holding periods of several years to realize full potential.
Growth investing targets companies with above-average earnings growth rates, even if their current valuations appear expensive. Growth investors believe that superior business performance will eventually justify higher prices, focusing on companies with expanding markets, innovative products, or disruptive business models.
Income investing prioritizes regular dividend payments and bond interest over capital appreciation. This strategy suits investors seeking steady cash flow, particularly retirees or those requiring predictable income streams. Dividend-paying stocks can provide both income and potential growth, though dividend cuts pose risks during economic downturns.
Momentum investing involves buying securities showing strong recent performance, betting that positive trends will continue. Momentum strategies require strict discipline and risk management, as reversals can occur quickly. These approaches work well during trending markets but struggle in sideways or volatile conditions.
Index investing offers broad market exposure through mutual funds or ETFs that track market indices like the Nifty 50 or Sensex. This passive approach provides instant diversification, low costs, and market-matching returns without requiring individual stock selection skills.
| Strategy Type | Risk Level | Time Horizon | Required Capital | Success Factors |
|---|---|---|---|---|
| Value Investing | Medium | 3–10 years | Moderate | Patience, research skills |
| Growth Investing | High | 2–7 years | High | Market timing, growth identification |
| Income Investing | Low–Medium | 5–20 years | Moderate | Dividend sustainability analysis |
| Momentum Trading | Very High | Days–months | High | Quick decision-making |
| Index Investing | Low–Medium | 10+ years | Low | Discipline, regular investing |
Risk Management and Portfolio Diversification
Understanding risk management is crucial to mastering How the Share Market Works effectively. Even the most sophisticated investment strategies can fail without proper risk controls and portfolio diversification.
Systematic risk affects entire markets and cannot be eliminated through diversification. Economic recessions, interest rate changes, and geopolitical events impact all stocks, though some may be more sensitive than others. Investors can hedge systematic risk through asset class diversification, international exposure, or derivative instruments.
Unsystematic risk is company-specific or sector-specific and can be reduced through diversification. Poor management decisions, product failures, or industry disruptions represent unsystematic risks that affect individual companies without impacting broader markets. Spreading investments across different sectors, company sizes, and geographical regions helps minimize these risks.
Position sizing determines how much capital to allocate to each investment, preventing any single position from causing devastating losses. Professional investors often limit individual positions to 2–5% of total portfolio value, ensuring that even complete losses on single investments won’t severely damage overall performance.
Stop-loss orders automatically sell positions when prices fall below predetermined levels, limiting downside exposure. While stop-losses provide protection against large losses, they can also force sales during temporary market volatility, potentially missing subsequent recoveries.
Portfolio rebalancing involves periodically adjusting allocations to maintain desired risk levels and take profits from outperforming assets. Regular rebalancing forces investors to sell high-performing assets and buy underperforming ones, effectively implementing a disciplined buy-low, sell-high approach.
| Risk Type | Examples | Mitigation Strategy | Impact Level |
|---|---|---|---|
| Market Risk | Economic recession, interest rate changes | Asset allocation, hedging | High |
| Credit Risk | Company bankruptcy, bond defaults | Credit analysis, diversification | Medium–High |
| Liquidity Risk | Unable to sell quickly | Maintain cash reserves | Medium |
| Currency Risk | Exchange rate fluctuations | Currency hedging | Medium |
| Inflation Risk | Purchasing power erosion | Real assets, inflation-linked bonds | Low–Medium |
Technology’s Role in Modern Trading
Technology has fundamentally transformed How the Share Market Works, democratizing access while increasing speed and efficiency. Electronic trading platforms now execute millions of transactions daily with minimal human intervention.
Mobile trading applications allow investors to monitor portfolios, place orders, and access research from anywhere with internet connectivity. These platforms provide real-time market data, advanced charting tools, and instant order execution that were once available only to professional traders.
Algorithmic trading uses computer programs to execute trades based on predetermined criteria, accounting for a significant portion of daily trading volume. While individual investors may not use sophisticated algorithms, they benefit from improved liquidity and tighter bid-ask spreads created by algorithmic market makers.
Artificial intelligence and machine learning are increasingly used for market analysis, pattern recognition, and automated trading decisions. These technologies can process vast amounts of data far more quickly than human analysts, identifying subtle patterns and relationships that might otherwise go unnoticed.
Robo-advisors provide automated portfolio management services, using algorithms to create diversified portfolios, rebalance holdings, and optimize tax efficiency. These services make professional-level portfolio management accessible to investors with modest account balances.
Blockchain technology and cryptocurrencies represent emerging technological frontiers that may reshape how markets operate in the future. While still evolving, these innovations could enhance transparency, reduce settlement times, and create new investment opportunities.
| Technology | Impact on Trading | Benefits | Challenges |
|---|---|---|---|
| Mobile Apps | Democratized access | 24/7 trading capability | Information overload |
| Algorithms | Automated execution | Faster, more efficient | Reduced human oversight |
| AI/Machine Learning | Enhanced analysis | Pattern recognition | Black box decisions |
| Robo-Advisors | Automated management | Low cost, objective | Limited customization |
| Blockchain | Settlement innovation | Transparency, security | Regulatory uncertainty |
Regulatory Framework and Investor Protection
The regulatory environment ensures that How the Share Market Works remains fair, transparent, and trustworthy for all participants. In India, the Securities and Exchange Board of India (SEBI) serves as the primary regulator, overseeing market operations and protecting investor interests.
SEBI’s mandate includes regulating stock exchanges, brokers, mutual funds, and other market intermediaries. The organization sets listing requirements for companies, mandates disclosure standards, and investigates market manipulation or insider trading. Recent regulatory updates include same-day settlement (T+0) for top 500 stocks and strengthened insider trading regulations.
Listing obligations require public companies to maintain transparency through regular financial reporting, corporate governance standards, and material event disclosures. These requirements help investors make informed decisions by ensuring access to relevant, timely, and accurate information.
Investor protection measures include deposit insurance for brokerage accounts, grievance redressal mechanisms, and investor education programs. SEBI operates investor protection funds that compensate investors in cases of broker defaults or market manipulation.
Circuit breakers and trading halts prevent excessive volatility by temporarily suspending trading when prices move beyond predetermined ranges. These mechanisms provide cooling-off periods during highly volatile situations, allowing rational decision-making to prevail over panic.
Market surveillance systems continuously monitor trading patterns for suspicious activities, using advanced analytics to detect potential manipulation or insider trading. These systems help maintain market integrity and investor confidence.
| Regulatory Aspect | Purpose | Implementation | Benefit |
|---|---|---|---|
| Disclosure Requirements | Transparency | Quarterly results, material events | Informed decisions |
| Listing Standards | Quality control | Financial, governance criteria | Investor protection |
| Trading Surveillance | Market integrity | Real-time monitoring | Fair markets |
| Grievance Redressal | Dispute resolution | Online platforms, ombudsman | Investor confidence |
| Capital Adequacy | Broker stability | Minimum capital requirements | System safety |
Economic Indicators and Market Correlation
Understanding how economic indicators influence How the Share Market Works enables investors to anticipate market movements and position portfolios accordingly. Economic data provides insights into the broader environment that affects corporate performance and investor sentiment.
Gross Domestic Product (GDP) growth rates reflect overall economic health and corporate earning potential. Strong GDP growth typically supports higher corporate profits and stock prices, while economic contractions often lead to market declines. However, markets are forward-looking and may anticipate GDP changes before official data release.
Inflation rates impact market valuations through their effects on interest rates and purchasing power. Moderate inflation often accompanies healthy economic growth, supporting stock prices. However, high inflation can erode real returns and prompt central bank tightening, creating headwinds for equity markets.
Interest rate changes directly affect equity valuations through their impact on discount rates used in valuation models. Lower interest rates make stocks more attractive relative to bonds, often supporting higher valuations. Conversely, rising rates can make fixed-income investments more competitive with stocks.
Employment data provides insights into consumer spending power and economic momentum. Strong job markets support consumer confidence and spending, benefiting companies across various sectors. Unemployment trends often correlate with market performance, though the relationship can be complex during economic transitions.
Currency exchange rates affect multinational companies and export-oriented businesses. A stronger domestic currency can hurt exporters by making their products more expensive internationally, while benefiting importers and companies with foreign operations.
| Economic Indicator | Market Impact | Time Lag | Sectors Most Affected |
|---|---|---|---|
| GDP Growth | Positive correlation | 1–2 quarters | Broad market |
| Inflation Rate | Negative correlation | 1–3 months | Consumer goods, utilities |
| Interest Rates | Inverse correlation | Immediate | Banking, real estate |
| Employment Data | Positive correlation | 1–2 months | Consumer discretionary |
| Currency Rates | Mixed correlation | Real-time | Export/import companies |
Building Your Investment Portfolio
Creating a successful investment portfolio requires understanding How the Share Market Works in practice through systematic planning and execution. Portfolio construction involves balancing risk and return objectives while considering individual circumstances and market conditions.
Asset allocation forms the foundation of portfolio construction, determining the percentage mix between stocks, bonds, and other investments. Age-based guidelines suggest that younger investors can afford higher stock allocations due to longer time horizons, while older investors might prefer more conservative approaches. However, individual risk tolerance and financial goals should ultimately guide these decisions.
Diversification within asset classes enhances risk management beyond basic asset allocation. Geographic diversification spreads risk across different economies and currencies. Sector diversification reduces exposure to industry-specific risks. Company size diversification balances growth potential with stability.
Regular investing through systematic investment plans (SIPs) helps average out market volatility and reduces timing risk. This dollar-cost averaging approach automatically purchases more shares when prices are low and fewer shares when prices are high. Consistency in investing often proves more important than perfect market timing.
Rebalancing maintains target allocations as market movements and performance differences cause portfolio drift. Annual or semi-annual rebalancing periods work well for most investors, though significant market movements might warrant more frequent adjustments. Rebalancing forces disciplined buying and selling that supports long-term performance.
Tax efficiency considerations can significantly impact after-tax returns. Holding investments for over one year qualifies for favorable long-term capital gains treatment. Tax-advantaged accounts like ELSS (Equity Linked Savings Scheme) provide deductions while building wealth.
Recommended Portfolio Allocation by Asset Class
| Portfolio Component | Allocation Range | Purpose | Risk Level |
|---|---|---|---|
| Large-cap Stocks | 40–60% | Stability, dividends | Low–Medium |
| Mid-cap Stocks | 15–25% | Growth potential | Medium |
| Small-cap Stocks | 5–15% | High growth | High |
| International Stocks | 10–20% | Diversification | Medium |
| Bonds/Fixed Income | 20–40% | Stability, income | Low |
Essential Investment Questions: Best Practices and Timing Guide
| Investment Question | Key Consideration | Recommended Action | Time Frame |
|---|---|---|---|
| When to start investing? | Time in market vs. timing market | Start as early as possible | Immediately |
| How much to invest? | Risk capacity and emergency funds | Start small, increase gradually | Ongoing |
| Which stocks to buy? | Research and diversification | Begin with blue-chip stocks | 3–6 months learning |
| When to sell? | Goal achievement or fundamental changes | Set clear criteria beforehand | As needed |
| How to track performance? | Regular review without overmonitoring | Monthly/quarterly reviews | Ongoing |
Conclusion: Your Journey in the Share Market
Understanding How the Share Market Works opens the door to potentially transformative wealth-building opportunities, but success requires patience, discipline, and continuous learning. The share market is not a get-rich-quick scheme but rather a wealth-creation vehicle for those who approach it with proper knowledge and realistic expectations.
The key principles we’ve explored—from fundamental analysis and diversification to risk management and regulatory compliance—form the foundation for intelligent investing. Whether you choose value investing like Warren Buffett, growth investing, or passive index investing, consistency and long-term thinking typically produce better results than attempting to time the market perfectly.
Remember that every successful investor started as a beginner, making mistakes and learning from experience. The Indian share market has created substantial wealth for patient investors over the decades, with companies delivering exceptional returns to long-term shareholders. Your journey may begin modestly, but with proper knowledge and disciplined execution, the share market can play a crucial role in achieving your financial goals.
The democratization of investing through technology means that opportunities once available only to the wealthy are now accessible to everyone. Take advantage of educational resources, start with small investments to gain experience, and gradually build your knowledge and confidence. Most importantly, never invest money you cannot afford to lose, and always maintain an emergency fund before beginning your share market journey.
Ready to begin your investment journey? Open a demat account with a reputable broker today, start with a systematic investment plan in a diversified mutual fund, and begin your path toward long-term wealth creation through equity investing.
Frequently Asked Questions About Share Market Operations
How much money do I need to start investing in the share market?
You can start investing with as little as ₹500 through mutual funds or ETFs. For direct stock purchases, most brokers allow investments starting from ₹100–500 per transaction. However, having ₹10,000–25,000 allows for better diversification and reduces the proportional impact of brokerage fees.
What is the difference between investing and trading in shares?
Investing involves buying shares with the intention of holding them for months or years, focusing on long-term wealth creation through company growth and dividends. Trading involves frequent buying and selling to profit from short-term price movements, requiring more time, skill, and capital while carrying higher risks.
How do dividends work and when are they paid?
Dividends are cash payments companies make to shareholders from their profits, typically declared quarterly or annually. The amount depends on company performance and board decisions. To receive dividends, you must own shares before the ex-dividend date, and payments are usually credited to your bank account within a few days of the payment date.
What happens if a company I invested in goes bankrupt?
If a company goes bankrupt, equity shareholders are last in line for any remaining assets after debt holders and preferred shareholders are paid. In most cases, common shareholders receive little or nothing. This risk can be managed through diversification and careful company selection based on financial strength.
How are stock prices determined in the market?
Stock prices are determined by supply and demand dynamics in real-time auctions. When more investors want to buy a stock than sell it, the price rises. When more want to sell than buy, the price falls. Factors influencing demand include company performance, market sentiment, economic conditions, and investor expectations about future prospects.
What is the role of stockbrokers and how do I choose one?
Stockbrokers facilitate buying and selling of shares by providing trading platforms, market access, and various services. Choose brokers based on brokerage fees, platform quality, research offerings, customer service, and regulatory compliance. Major brokers in India include Zerodha, Angel One, HDFC Securities, and ICICI Direct.
How do taxes apply to share market investments?
Short-term capital gains (holding period less than 1 year) on equity investments are taxed at 15%, while long-term capital gains exceeding ₹1 lakh annually are taxed at 10%. Dividend income is taxed according to your income tax slab. Securities Transaction Tax (STT) applies to all transactions, and TDS may be deducted on dividend payments.
What are the risks of investing in the share market?
Main risks include market risk (overall market decline), company-specific risk (individual stock problems), liquidity risk (difficulty selling), inflation risk (purchasing power erosion), and currency risk (for international investments). These risks can be managed through diversification, research, and appropriate position sizing.
Disclaimer
The information shared on Calculator Singh is for educational and informational purposes only. We are not SEBI-registered financial advisors or licensed insurance agents. Please consult a qualified financial advisor or tax professional before making any investment, insurance, or financial decisions. You are solely responsible for your financial choices — Calculator Singh will not be liable for any losses or risks arising from the use of our content.